Dashed Lines and Rasterization#
Base Dashed Line#

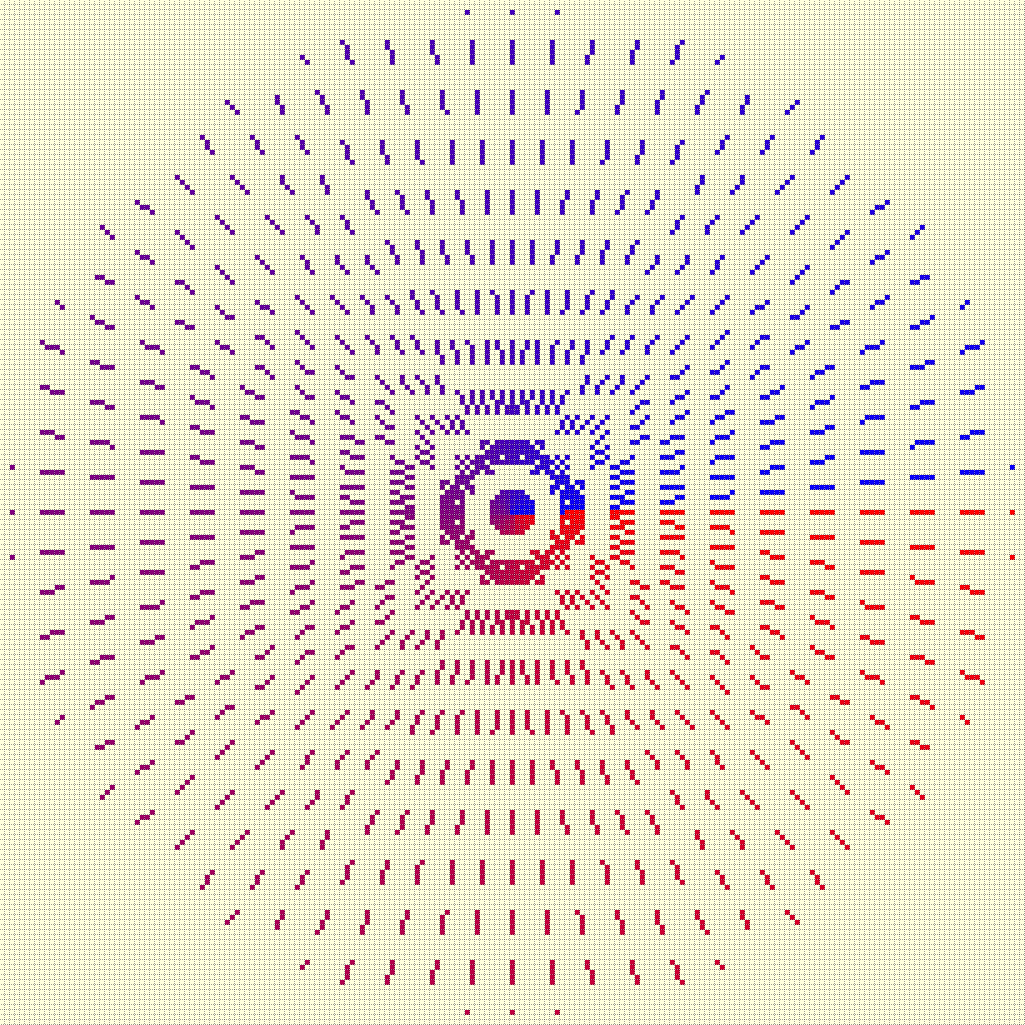
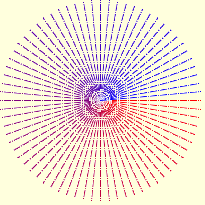
Dashed Lines made by Zigl Algorithm#
Note the square patterns
Now that we have the scripts for lines, antialiased lines and thick antialiased lines let's see if we can produce a good set of dashed lines. To start let's choose the plain rasterized line, there is not much to choose between the Bresenham and Zigl algorithms, other than the reason that Zigl's algorithm will be extended for antialiasing and thick line antialiasing.
With direct access to the line drawing algorithm we can simply switch the plotting on and off. Use the dash tuple to create a list (pattern) of 1's and 0's corresponding to the lengths of the dashes and spaces. Within the range part add an if clause to plot only when the list element corresponds to a 1. The list is simply cycled within the for loop.
Show/Hide Dashed Line One Pixel Wide
def zigl_dash(dr, pta, ptb, dash=(), fill='black'):
    # check dash input
    if len(dash)%2 == 0 or len(dash) ==1:
        pass
    else:
        raise Exception('The dash tuple: {} should be one or an equal number '\
                    'of entries'.format(dash))

    dash = dash + dash if len(dash) == 1 else dash # single entry

    sum_dash = sum(dash)

    pattern = []
    while len(dash) > 0:
        dash0, *dash = dash
        pattern.extend([1] * dash0) # dashes
        dash0, *dash = dash
        pattern.extend([0] * dash0) # spaces
    if not pattern:
        pattern.append(1)

    count = 0

    x0, y0 = pta
    x1, y1 = ptb

    dx = x1 - x0
    dy = y1 - y0

    xsign = 1 if dx > 0 else -1
    ysign = 1 if dy > 0 else -1

    dx = abs(dx)
    dy = abs(dy)

    err = dx - dy
    dr = dx + 1 if dx > dy else dy + 1

    for x in range (dr):
        if pattern[count] == 1:
            draw.point([x0, y0], fill= fill)
        e2 = err<<1

        if e2 >= -dx:
            err -= dy
            x0 += sx

        if e2 <= dy:
            err += dx
            y0 += sy

        count = count + 1 if count < sum_dash - 1 else 0
It should be noted how straightforward the creation of dashed lines is made by using rasterization, apart from adding a list that stores the pattern with a count based on this list. The question of changing dash and space lengths has not been encountered.
Adjust for Slope#
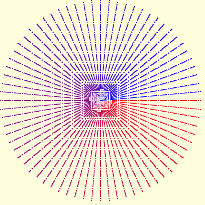
As of yet no attempt has been made to regulate the dash and space sizes relative to their orientation, if adjusted then the rectangular pattern in the figure above will become more circular.
Adjusted Dashed Lines made by Zigl Algorithm#
The square pattern is less pronounced
Alter the lengths of the dash and space elements according to the slope of
the line, keeping the same overall length. This means that when close to 45°
the dashes will shorten. Modify the script above, add an adjust option,
then when this option is set to True calculate the slope, and allow the
dash and space lengths to be modified dependant on the slope. If the slope
is shallow base the length on cos, steep slopes base the length on sin. The
result has to be an integer rounded up to safeguard single dashes or spaces
Show/Hide Adjusted Dashed Line One Pixel Wide
def zigl_dash(dr, pta, ptb, dash=(5,5), fill='red', adjust=False):
    # check dash input
    if len(dash)%2 == 0 or len(dash) ==1:
        pass
    else:
        raise Exception('The dash tuple: {} should be one or an equal number '\
                    'of entries'.format(dash))
    dash = dash + dash if len(dash) == 1 else dash
    #sum_dash = sum(dash)

    x0, y0 = pta
    x1, y1 = ptb
    dx = (x1 - x0)
    dy = (y1 - y0)

    if adjust is True:
        slope = atan2(dy, dx)
        slope = slope if slope >= 0 else (2*pi + slope)

    dx = abs(dx)
    dy = abs(dy)

    pattern = []
    while len(dash) > 0:
        dash0, *dash = dash
        if adjust is True:
            dash0 = abs(int_up(dash0*cos(slope) if dx >= dy else dash0*sin(slope)))
        pattern.extend([1] * dash0) # dashes
        dash0, *dash = dash
        if adjust is True:
            dash0 = abs(int_up(dash0*cos(slope) if dx >= dy else dash0*sin(slope)))
        pattern.extend([0] * dash0) # spaces

    if not pattern:
        pattern.append(1)

    count = 0

    len_pattern = len(pattern)
    sx = 1 if x0 < x1 else -1
    sy = 1 if y0 < y1 else -1
    err = dx - dy
    dr = dx + 1 if dx > dy else dy + 1

    for x in range (dr):
        if pattern[count] == 1:
            draw.point([x0, y0], fill= fill)
        e2 = err<<1

        if e2 >= -dx:
            err -= dy
            x0 += sx

        if e2 <= dy:
            err += dx
            y0 += sy
    count = count + 1 if count < len_pattern -1 else 0
Adding Antialiasing#
Antialiased Dashed Lines#
The square pattern shows
Antialiased Dashed Adjusted Lines#
The square pattern has been broken up
Antialiasing can be simply added to the above scripts.
Show/Hide Dashed Line Antialiased
def plotDashAA(draw, pta, ptb, dash=(5,5), fill='black', adjust=False):
    # draw a black antialiased line on white (255) background
    # check dash input
    if len(dash)%2 == 0 or len(dash) ==1:
        pass
    else:
    raise Exception('The dash tuple: {} should be one or an equal number '\
                    'of entries'.format(dash))
    dash = dash + dash if len(dash) == 1 else dash

    x0, y0 = pta
    x1, y1 = ptb

    dx = (x1 - x0)
    dy = (y1 - y0)

    if adjust is True:
        slope = atan2(dy, dx)
        slope = slope if slope >= 0 else (2*pi + slope)

    dx = abs(dx)
    dy = abs(dy)

    pattern = []
    while len(dash) > 0:
        dash0, *dash = dash
        if adjust is True:
            dash0 = abs(int_up(dash0*cos(slope) if dx >= dy else dash0*sin(slope)))
        pattern.extend([1] * dash0) # dashes
        dash0, *dash = dash
        if adjust is True:
            dash0 = abs(int_up(dash0*cos(slope) if dx >= dy else dash0*sin(slope)))
        pattern.extend([0] * dash0) # spaces

    if not pattern:
        pattern.append(1)
    len_pattern = len(pattern)

    count = 0
    sx = 1 if x0 < x1 else -1
    sy = 1 if y0 < y1 else -1
    err = dx - dy                            # error value e_xy

    ed = dx + dy

    ed = 1 if ed == 0 else sqrt(dx*dx+dy*dy) # max(dx, dy) #
    dr = dx + 1 if dx > dy else dy + 1      # better plotting when steep

    for x in range (dr):                    # pixel loop
        if pattern[count] == 1:
            hue = int(255*abs(err-dx+dy)/ed)
            draw.point([x0, y0], fill=(hue, hue, hue))

        e2 = err
        x2 = x0

        if e2<<1 >= -dx:                    # y-step
            if e2+dy < ed and x < dr - 1 and pattern[count] == 1:
                hue = int(255*(e2+dy)/ed)
                draw.point([x0,y0+sy], fill=(hue, hue, hue))

            err -= dy
            x0 += sx

        if e2<<1 <= dy and x < dr - 1:      # x-step
            if dx-e2 < ed and pattern[count] == 1:
                hue = int(255*(dx-e2)/ed)
                draw.point([x2+sx,y0], fill=(hue, hue, hue))

            err += dx
            y0 += sy

        count = count + 1 if count < len_pattern -1 else 0
Since dashed lines can have small dash sizes it was felt that thick lines would not be appropriate, however we can add the default dictionary and enable colour choices, as seen in thick lines:
....
def errs(comp, size,j):
    return 255 if comp == 255 else int((255-comp) * j / size) + comp

diffs = defaultdict(list)
diffs = defaultdict(lambda:back, diffs)
for i in range(int(ed)+1):
    if fill == (0,0,0):
        diffs[i] = tuple(int(255*i/ed) for j in range(3))
    else:
        diffs[i] = tuple(errs(fill[j],ed,i) for j in range(3))
....
            draw.point((x0, y0), fill=diffs[abs(err-dx+dy)]) # main line
....
            draw.point([x0, y0+sy], fill=diffs[abs(e2+dy)])  # y-step
....
            draw.point([x2+sx, y0], fill=diffs[abs(dx-e2)])  # x-step
....